
Project Dashboards
Quickly Communicating Project Progress

© iStockphoto
triloks
Keep a close eye on what's happening with your project.
In today's busy organizations, project and program managers need to know exactly how the projects they're responsible for are doing. But they also rarely have the time to read through detailed status reports covering all aspects of the project.
Perhaps Project A is on time and on budget, but is it going to deliver all of the functionality that your sponsor needs? Or maybe engineers have been working overtime to ensure that every last bug has been ironed out. But how can you find out what this overtime has done to the budget?
From this "time versus information" dilemma grew the concept of the Project Dashboard. Just as a car's dashboard provides immediate and up-to-date information about the speed of the vehicle, the amount of gas in the tank and the temperature of the engine, a Project Dashboard provides immediate and up-to-date information about the status of a project. A common and easily understood approach to using the dashboard is to use red, yellow or green symbols that quickly identify whether the thing being measured is in good shape (green), requires attention (yellow), or is in critical condition (red).
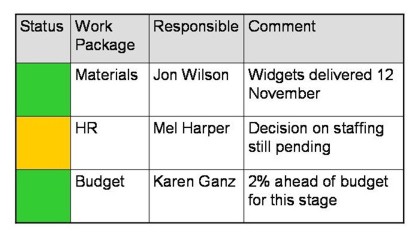
With a Project Dashboard you no longer have to wade through three different reports to determine whether the production department received the widgets it needed, and got permission to hire its new employees. Instead, if the widgets had arrived but a decision on staffing was pending, you would see that the Materials gauge was in the optimum zone and that the Human Resources gauge was registering in the warning zone:
With the overall simplicity of a dashboard, you need to remember that dashboards are not, in and of themselves, a panacea. The end product is only as good as the inputs. A dashboard is only an effective tool if firstly the right things are being tracked and secondly, the classifications being made are well-judged.
Tip 1:
It's easy to descend into a quantitative and analytical mess with Project Dashboards. At root, managers want a simple, quick way of seeing whether there are problems they need to address. Reliance on a quantitative approach gives people a way of "wriggling out" of their accountability for reporting this. As a "client" of the Project Dashboard, you need to insist that the people reporting to you are personally accountable for their Project Dashboard judgment calls.
Tip 2:
If you're a client, beware false positives. Make sure you allocate time to go into detail on individual cases, so that you can confirm to yourself that classifications are fair and reliable. Otherwise you risk being disastrously hoodwinked! On the other hand, make sure that people don't waste your time by flagging up trivial issues as needing attention. Make sure people take responsibility for solving these themselves!
How to Use the Tool
Follow these steps to use the Project Dashboard:...
Access the Full Article
This article is only available in full within the Mind Tools Club.
Learn More and Join TodayAlready a Club member? Log in to finish this article.
