
Linear Programming
Optimizing Your Limited Resources

© iStockphoto
BartCo
When resources are limited, you need to allocate them wisely.
If you've only got limited resources at your disposal, then it's helpful to calculate how best to maximize those resources – whether that's time, money, or space.
Let's say, for example, that you have 50 square feet of office space to use for storage.
Your budget is $200, and there are a variety of cabinet types and sizes from which to choose.
How do you optimize the space you have available, and stay within the allotted budget?
Or suppose you have three delivery trucks, and 10 drop-off points.
How do you plan the most efficient route and schedule for these trucks?
Or consider that you manufacture three products using the same basic raw materials. However, as each product uses different amounts of material, some are more expensive to produce than others. A few of the materials are perishable, and need to be used quickly. How much of each product should you manufacture to minimize your cost? And which combination produces the least waste?
Questions like these may seem very complex. With so many variables and constraints to take into consideration, how do you decide what to do? The answer is to use linear programming.
Linear programming is a mathematical technique that determines the best way to use available resources. Managers use the process to help make decisions about the most efficient use of limited resources – like money, time, materials, and machinery.
Note:
You can use linear programming only if there is a linear relationship between the variables you're looking at. The relationship is linear if a unit change in one is connected to a constant amount of change in the other. On a graph, a linear relationship is shown as a straight line.
The Linear Programming Technique
To help you understand linear programming, we'll work through an example. Let's say your company makes two products – Joops and Goops. The capacity of your manufacturing unit is 525 hours per week. It takes five hours to produce one Joop, and three hours to produce one Goop.
| Labor hours per unit | |
|---|---|
| Joops (J) | Goops (G) |
| 5 hours | 3 hours |
| Capacity = 525 hours | |
Your customer demand for Goops is unlimited. They will buy as much as you can produce. Joops, on the other hand, have a maximum demand of only 100 per week.
Your suppliers can only provide you with the raw materials needed to produce a maximum of 75 Goops per week. The raw materials for Joops are freely available.
The profit per unit, or unit contribution (C) is $2.50 for a Joop, and $2.00 for a Goop.

Subscribe to Our Newsletter
Receive new career skills every week, plus get our latest offers and a free downloadable Personal Development Plan workbook.
Read our Privacy PolicyHow many units of Joops and Goops should you produce each week to maximize your profit?
1. Express the Problem Mathematically
Maximize:
C = 2.5J + 2G (maximum profit)
Subject to these capacity constraints:
5J + 3G ≤ 525 (capacity constraint)
J ≤ 100 (Joop sales constraint)
G ≤ 75 (Goop raw materials constraint)
2. Graph the Problem
When you have two variables (our example has two product combinations), you can draw up a graph to show the solution. This is a great tool for understanding the question in its entirety. With Joop production on the x-axis, and Goop production on the y-axis, your graph can show the maximum production capacities for all possible combinations of Joops and Goops.
-
Draw the capacity line:
The end points of the capacity line are the maximum possible Joops and Goops that can be produced.
You can produce:
105 Joops (525/5) and 0 Goops (100,0)
or
0 Joops (0,175) and 175 Goops (525/3)The capacity line joins these two points.
- Draw the sales constraint line for Joops as J = 100 for all values of G.
- Draw the raw materials constraint for Goops as G = 75 for all values of J.
These three constraint lines are shown below.
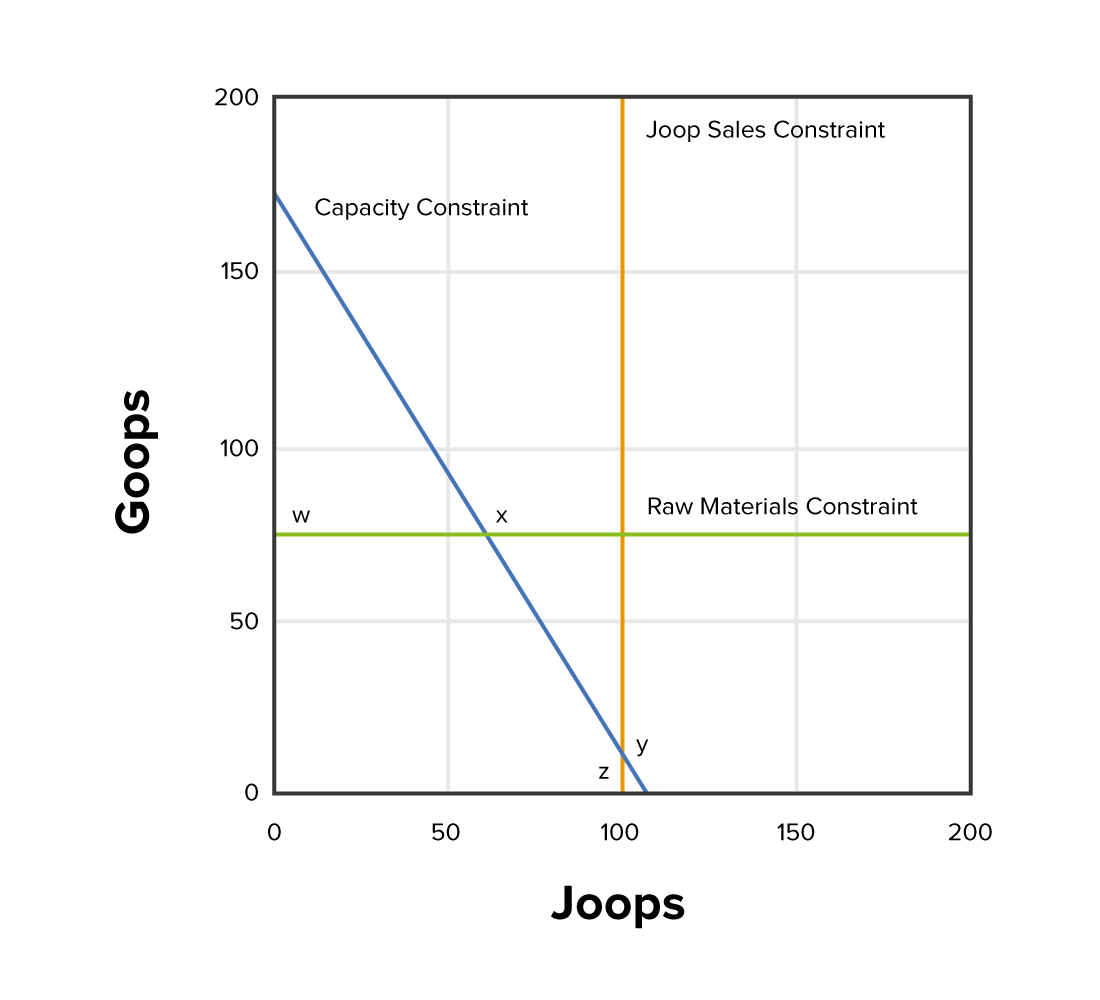
The area bounded by the three constraint lines and the x and y axes is the set of possible combinations of Joop and Goop production. Anything beyond those borders is not possible – given these constraints, and assuming that production of Joops and Goops is greater than 0.
The optimal combination will be somewhere along the outside border. Anything inside the boundary would not use all of the available capacity.
3. Calculate the Optimal Value
How do you know where on the boundary the optimization point is? It will be at one of the intersections of the various constraint lines. In this example, there are four intersection points (w, x, y, and z). To determine the exact point of optimization, you examine each of these. As you already know that points w and z represent the extreme points used in the constraint lines, you can consider the calculations below.
-
Maximum contribution (C) at point w
J = 0, G = 75
C = 2.5J + 2G (maximum profit)
C = (2.5 x 0) + (2 x 75)
C = 150 -
Maximum contribution (C) at point x
5J + 3G = 525
G = 75Substitute the value of G in the first equation, and solve for J:
5J + (3 x 75) = 525
5J = 300
J = 60So at point x the production is 60 Joops and 75 Goops:
C = 2.5J + 2G (maximum profit)
C = (2.5 x 60) + (2 x 75)
C = 120 +150
C = 270 -
Maximum contribution (C) at point y
5J + 3G = 525
J = 100Substitute J = 100 into the first equation:
(5 x 100) +3G = 525
3G = 25
G = 8 (round down because you cannot sell part of a Goop)C = 2.5J + 2G (maximum profit)
C = (2.5 x 100) + (2 x 8)
C = 250 +16
C = 266 -
Maximum contribution (C) at point z
J = 100, G = 0
C = 2.5J + 2G (maximum profit)
C = (2.5 x 100) + (2 x 0)
C = 250
Based on these calculations, the optimal production for Joops and Goops is at point x (60 Joops and 75 Goops).
This is a simple linear programming example. In reality, most business problems involve so many variables and constraints that you wouldn't (or couldn't) try a manual solution. Linear programming software programs can solve the equations quickly and easily, and they provide a great deal of information about the various points within the possible set. You can also run "what if" scenarios to determine things such as which additional machinery to buy, or whether to add an extra shift of workers.
Key Points
Linear programming uses a mathematical or graphical technique to find the optimal way to use limited resources.
When you have a problem that involves a variety of resource constraints, linear programming can generate the best possible solution. Whether it's maximizing things like profit or space, or minimizing factors like cost and waste, using this tool is a quick and efficient way to structure the problem, and find a solution.
This site teaches you the skills you need for a happy and successful career; and this is just one of many tools and resources that you'll find here at Mind Tools. Subscribe to our free newsletter, or join the Mind Tools Club and really supercharge your career!


Hope you've been enjoying your weekend! (Wow, I haven't seen this type of calculation in a WHILE! LOL) Let's start with the three constraints:
[1] maximum capacity of products:
-If zero goops are produced, a max of 105 joops can be produced. (Represented by coordinates 105,0)
-If zero joops are produced, a max of 175 goops can be produced. (Represented by coordinates 0,175)
-The line connecting these two points is the capacity line, representing the maximum combinations of manufacturing these two products. (Represented by the blue line)
If there were NO constraints on demand (sales) or raw materials, the optimal production levels would fall along the blue line. Any combinations of production falling below the line and within the triangular area between points (0,175), (0,0), and (105,0) would not use all of the available capacity.
[2] maximum sales limit:
-There is an unlimited demand for goops.
-The max demand for joops is 100/week.
-Regardless of the number of goops demanded, the maximum number of joops demanded is 100/week. (Represented by the orange line)
[3] maximum raw materials limit:
-There is no supply limit of raw materials for joops.
-The max supply of raw materials for goops is 75/week.
-Regardless of the available raw materials for joops, the maximum supply of goops is 75/week. (Represented by the green line)
Now, let's look at what can be produced after factoring in demand limits on joops and supply limits on raw materials for goops.
[1] When producing zero goops, the demand constraint reduces the maximum capacity of joops made from 105 (at coordinates 105,0) to 100 (represented as Point Z at coordinates 100,0).
[2] When producing zero joops, the available raw materials constraint reduces the maximum capacity of goops made from 175 (at coordinates 0,175) to 75 (represented as Point W at coordinates 0,75).
[3] Point X (coordinates 60,75) represents an optimal production level for joops and goops with the maximum raw materials of goops.
[4] Point Y (coordinates 100,10) represents an optimal production level for joops and goops with the maximum demand of joops.
[5] The pentagonal area factoring the three constraint lines and the two axes at (0,0), (0,75), (60,75), 100,10), and (100,0) represents the available area of production. Constraints on raw materials, demand, and general capacity prevent production outside this border. Any combinations of production falling below or within this area would not use all of the available capacity. Any point ALONG this pentagon represents a maximum production level.
I hope this explanation helps you better understand the graph. Let us know!
Best,
Sonia
-Mind Tools Team
I'm glad you found this linear programming article useful! I was able to follow it and wish I could share a marked-up graphic with my post. That would be quicker. I'd be happy to post a written version for you in a separate comment.
~Sonia
Mind Tools Team