
Systems Diagrams
Understanding How Factors Affect One Another

© iStockphoto
luke_63
Systems diagrams allow you to model complex systems.
Systems diagrams are powerful tools that help you to understand how complex systems work.
They're particularly helpful for showing you how a change in one factor may impact elsewhere. They're excellent tools for flushing out the long-term impacts of a change. Importantly, a good systems diagram will show how changing a factor may feed back to affect itself!
Drawing a systems diagram is a good way of starting to build a computer model. The technique helps you to map out the structure of the system to be modeled. It shows the factors and relationships that are important, and helps you to start quantifying the linkages between factors.
How Do Systems Diagrams Work?
To explore how systems diagrams work, let's look at seven key aspects of them:
1. Relationships Between Factors
At the heart of the use of systems diagrams is the idea of linking factors to show a relationship between them.
For example a company may link the factors of product quality and customer satisfaction. It believes that as the quality of its goods changes, so will customers' happiness. We show this as an arrow linking the two factors:
Figure 1: A Simple Same-Way Relationship Between Two Factors

The S shows that the factors move in the Same way – as quality improves, so will the happiness of customers. The arrow shows the direction of the relationship: raising customer happiness does not raise the quality of the goods!
These relationships can also work the other way. The company may link price with the customers' perceptions of the "good value" of its goods. This is shown below.
Figure 2: An Opposite Relationships Between Two Factors

The O shows that the relationship works in the opposite way: in this case, as you raise the price, customers' perceptions of good value reduce.
2. Feedback Loops
Feedback is an important concept in the use of systems diagrams. In very many cases, changing one factor will impact on another factor, which will then affect the first.

Subscribe to Our Newsletter
Receive new career skills every week, plus get our latest offers and a free downloadable Personal Development Plan workbook.
Read our Privacy PolicyFeedback will either reduce the impact of the change, or amplify it.
3. Balancing Loops
Where feedback reduces the impact of a change, we call this a "balancing loop." The example below shows an example of a balancing loop, where an under-resourced service company is trying to raise quality.
Figure 3: An Example Balancing Loop
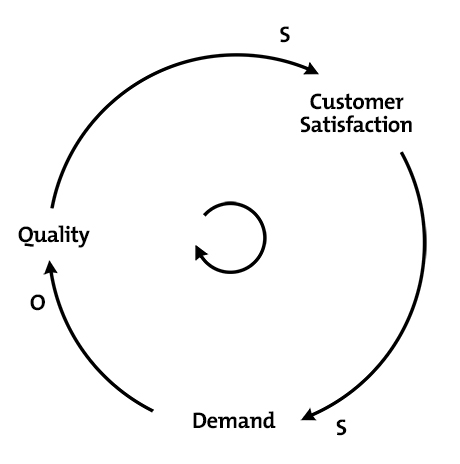
Diagram reproduced from the “The Fifth Discipline” by Peter M Senge. ©2006. Reprinted by permission of Penguin Random House.
In this situation, improving the quality of service leads to improved customer satisfaction, which leads to an increase in demand for the company's service. In trying to meet this demand, the company has less time to devote to individual customers, which reduces its ability to improve quality further.
Note the small circular arrow in the middle of the loop. This shows which way round the loop is running. In complex diagrams with many loops, this arrow will be labeled and will identify loops.
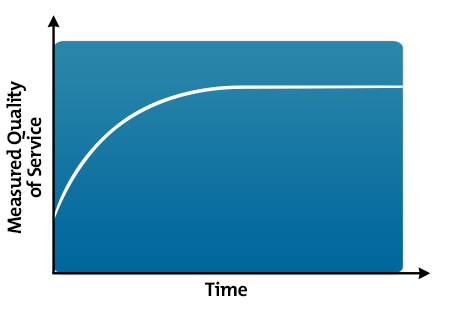
The graph below shows how quality of service might vary with time in the example above.
Figure 4: Graph Showing How Quality Changes Over Time in the Balancing Loop in Figure 3
4. Reinforcing Loops
Where feedback increases the impact of a change, we call this a "reinforcing loop." The example below shows an example of a theater trying to improve its profitability by investing more in productions.
Figure 5: Reinforcing Loop Showing the Effect of Increasing Investment in a Theater
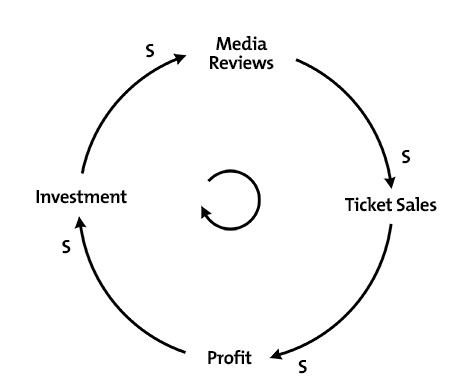
As more investment is put into a production, the theater is able to put on more-lavish plays with more-famous actors. Better plays should bring better reviews, and therefore higher ticket sales. This should lead to higher profitability, and therefore more money available to invest in future productions.
A graph showing how ticket sales might vary against time is shown below.
Figure 6: Graph Showing the Effect on Sales of the Reinforcing Loop in Figure 5
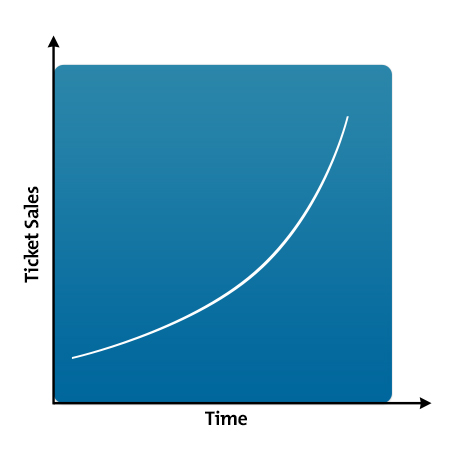
Note that this assumes that investment is increasing as time goes on. It also ignores some important facts: firstly that there is only a certain number of seats in the theater, and secondly that external factors such as competition and market saturation will eventually limit growth. On a systems diagram showing the way that the theater operates, these factors would be shown as balancing loops impacting on this reinforcing loop.
5. External Factors
The systems diagrams that we've looked at so far completely ignore the impact of these external factors on them.
In our balancing loop example above we assumed that demand was raised only as customers became more satisfied. In reality, demand is just as likely to be affected by the state of the economy. This is shown in the modified diagram below.
Figure 7: Diagram Showing the Effect of an External Factor on a System
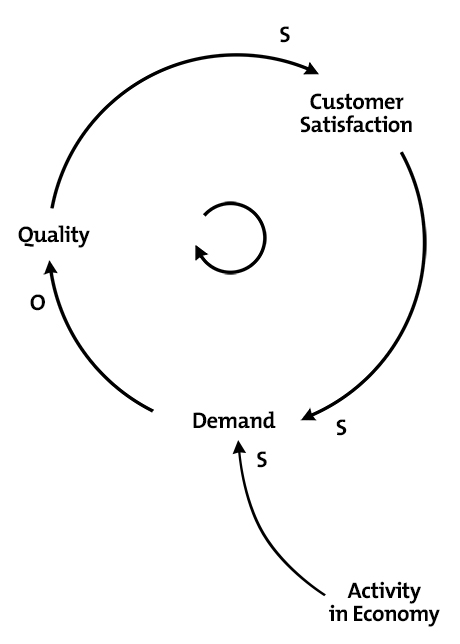
We show an external factor as a labeled relationship arrow pointing to the appropriate part of the systems diagram.
6. Gaps
In our reinforcing loop example above we related sales of theater seats to investment in productions. What we weren't able to build into the model was the fact that there's a limited number of seats in the theater.
Inevitably this will cap the growth of ticket sales, as the theater will seriously upset customers if it sells more tickets than it has seats available!
We build this into our model with the idea of a gap. There's a gap between the number of seats available (an external factor we haven't yet built into our model), and the number of seats used (tickets sold).
As the theater sells more tickets, the size of this gap reduces. At a particular point it can't sell any more tickets. Increases in investment beyond this point may not yield any more profit.
We show this by modifying our diagram to both show both the external factor of the limit of the number of seats, and to show the gap:
Figure 8: Systems Diagram Showing the Effect of a Gap on a System
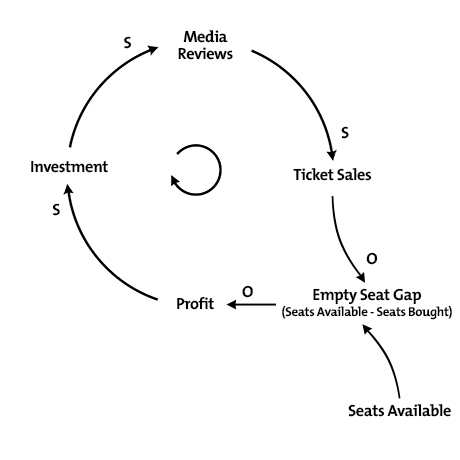
When all seats are sold, i.e. when seats available - seats bought = 0, then profit will not rise any higher unless other factors are brought into the system.
Note that it's very important to get the gap definition correct for your model.
7. Delay
The impact of delay is the final area we need to consider in our systems diagrams.
Ideally when we make a change to a system it should adjust immediately to its new state. In reality, there's almost always a delay before other factors adjust. This delay may occur in a mechanical system simply as a result of inertia and friction. In a human system it will occur as people take time to communicate, get used to new ideas, and implement change.
We can show this delay in a simple model using antelopes and cheetahs. As the number of antelopes rises, more food is available for the cheetahs. More cheetahs will therefore survive, and will be able to breed.
One part of the delay within this system is given by the length of time it takes for a cheetah to be born and grow to maturity. The other part occurs as starving cheetahs take time to die.
Feedback occurs as cheetahs kill antelopes. The higher the number of cheetahs, the greater will be their impact on the antelope population.
The figure below shows this.
Figure 9: Diagram Showing Delay in a System
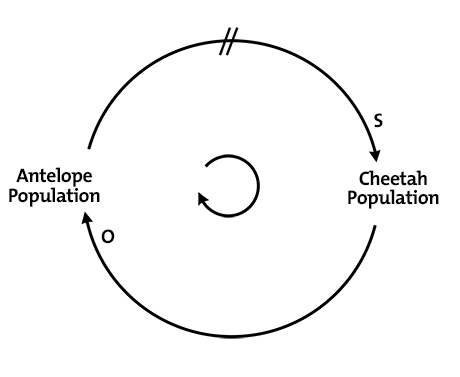
Note the double slash on the line showing the relationship between the antelope and cheetah populations. This shows that some form of delay is slowing the change of the related factor.
If there was no delay within the system, we might expect to see a graph showing the number of cheetahs over time like the one below.
Figure 10: Graph Showing the Adjustment in Cheetah Population in the Example in Figure 9 If There Was No Delay
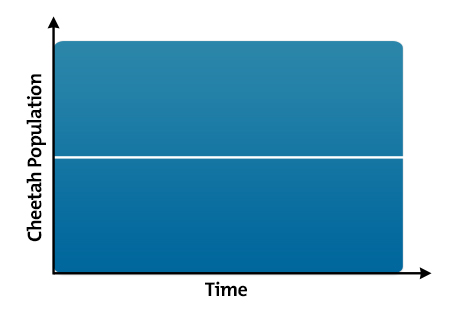
Here adjustment would be immediate. Any change in the antelope population would be instantly matched by an increase in the cheetah population. These additional cheetahs would eat the additional antelopes, and then die immediately.
The delay in the system causes it to behave in a different way:
- Firstly, the cheetah population will take time to increase.
- Next, the large population of cheetahs will continue to breed as food starts to become scarce.
- This number of cheetahs will cause a big reduction in the number of antelopes.
- This will then lead to a crash in cheetah population as animals starve.
- The antelope population will then recover as there will be fewer cheetahs to restrict their numbers.
If nothing else has any impact on this system, then cheetah numbers may oscillate as shown below:
Figure 11: Graph Showing the Effect on Cheetah Populations When Delay Is Considered in Figure 9
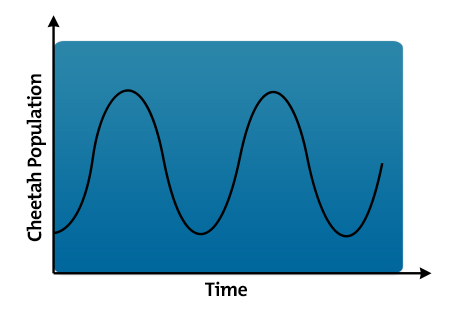
This occurs as the cheetah population continually over-adjusts, first in growth, and then in decline. In this system, the longer it takes for a cheetah to breed and starve – i.e. the greater the delay – the greater will be the variations in cheetah populations.
Improving the Systems Model
The models we've looked at so far have been simple – they've ignored many possible impacts on each system. For example, in our model of antelopes and cheetahs, we've ignored the impact of disease, drought, human activity, etc.
We improve the model by building in as many of these external factors as we can think of. We can then simplify it by eliminating those factors that have a negligible impact.
External factors might be:
- Natural – weather, natural resources, disease, environmental change, etc.
- Technological – new technologies, changes in technology, etc.
- Human – psychological, emotional, ambitions, expectations, etc.
- Political – ideology, corruption, effectiveness, interest, etc.
- Social – values, social inertia, traditions, philosophies, etc.
- Financial – state of the economy, capital available, etc.
Ultimately, you may end up with a model made up of a number of reinforcing loops, balancing loops, and external factors. The example below shows a more sophisticated diagram of the antelopes and cheetahs system.
Figure 12: The Completed Systems Model Showing the Way in Which Antelope and Cheetah Populations Vary
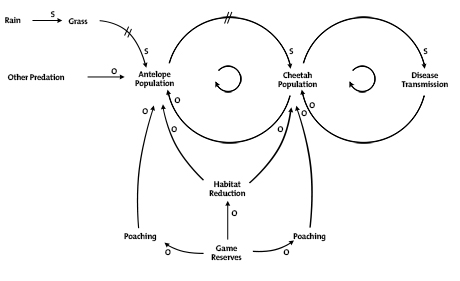
Note: This diagram is an example only and does not necessarily reflect how antelope and cheetah populations operate in real life.
Systems Diagrams as the Basis of Computer Models
Once you've established the relationships between factors on your diagram, you can look to see if you can put numbers to the relationships. In the example above you may find that if drought halves the amount of grass available to antelopes, then the antelope population reduces by one third.
You can build this relationship into a computer model. A useful way of starting this with simple and moderately complex models is to build the model on a spreadsheet.
You can use this model to make predictions by changing factors within it. This would allow you to assess the likely impact on your system of external changes, and investigate the effect of changes you might make within the system.
Note:
This article draws on the work of Peter Senge of the MIT Sloan School of Management, and his concepts of "systems thinking" and the "learning organization." To learn more, read Senge's highly influential 1990 book, "The Fifth Discipline."
Key Points
Systems diagrams allow you to model the way in which complex systems work. They help you to think through the way in which the factors within a system interact and feed back upon themselves.
Using a systems diagram, you can analyze:
- How factors are related, and how one factor will change when another changes.
- How factors may feed back in either balancing loops or reinforcing loops.
- How external factors impact on the system.
- How gaps operate.
- How delay affects the system.
- All the complexities of a system.
This site teaches you the skills you need for a happy and successful career; and this is just one of many tools and resources that you'll find here at Mind Tools. Subscribe to our free newsletter, or join the Mind Tools Club and really supercharge your career!


Thanks for the feedback and we're pleased to hear that the article helped with your understanding. Thanks for the suggestion which I will pass on to the editorial team for their consideration.
Regarding your questions about whether a systems diagram by used to explain somethring like an automobile repair shop. I believe that it can. System diagrams can be used for any process with individual steps such as from the point when a customer walks in the door to when they leave.
Midgie
Mind Tools Team
(inputs -> conversion -> outputs) activities? can a systems diagram be used to explain this for example, an automobile repair shop?
If there is anything on our website you need help with, you're more than welcome to let us know.
Yolandé
Mind Tools Team