
Process Decision Program Charts
Managing Risk Methodically

© iStockphoto
danefromspain
Identify the hidden risks in your process or project.
Kharina heads up a large electronics company, and has just received a message from a national newspaper's "consumer champion." The reporter asks her how she plans to deal with the current crisis, and why the company doesn't put its customers first.
Kharina didn't realize that there was a problem, so she schedules an emergency meeting with her head of distribution, Max, to find out what's gone wrong.
Closer investigation reveals that the organization's name is trending on social media… for all the wrong reasons. There have been many customer complaints about missed, late or incorrect deliveries, damaged packages, and a lack of action from the company's complaints team.
Kharina is disappointed to discover that Max hasn't done anything about these problems – he needs to improve process management in his department, and fast. So, Kharina asks him to create a process decision program chart for the distribution team, so that they can identify where the problems are happening and address them effectively.
In this article, we'll explore how you can use a process decision program chart (PDPC) to improve process management, process flow, process risk management, and contingency planning.
Note:
See our article on flow charts for a more in-depth understanding of how to think about and communicate workflows or processes. Swim Lane Diagrams are also useful for projects or processes that involve several people or teams, and you could use storyboards to illustrate the steps in a process.
Understanding Process Decision Program Charts
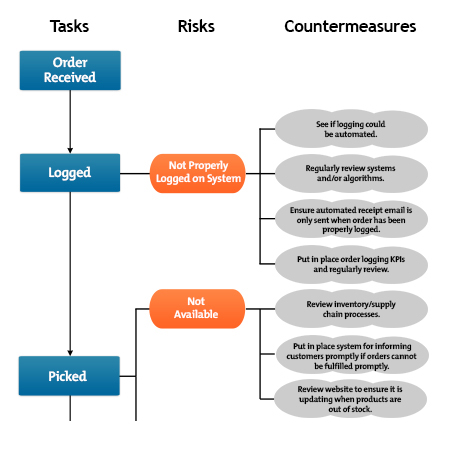
A PDPC (see Figure 1, below, for a snapshot) is similar to a flow chart in many ways. For example, it's a diagram that illustrates a process from start to finish, showing how different elements fit together. However, PDPCs are particularly helpful for identifying risks, and outlining how to mitigate them by developing and planning countermeasures.
Figure 1 – Snapshot of a PDPC
PDPCs were developed in the second half of the 20th century by the Union of Japanese Scientists and Engineers. They formed part of a set of tools intended to solve qualitative problems, such as identifying and resolving issues and dealing with customer complaints.
How to Create a Process Decision Program Chart
PDPCs are easy to create and use. They help you to consider risks methodically at the planning or review stage of a project or process, so that you don't overlook anything, and they make it easy to communicate about this with your team members....
Access the Full Article
This article is only available in full within the Mind Tools Club.
Learn More and Join TodayAlready a Club member? Log in to finish this article.
